To kick off yesterday's Leafs Links, Bower Power posted a graph which showed how teams fared relative to their spending over the last five seasons. What I've done is expand on BP's work here.
Below is a graph which shows the cumulative spending on the 30 NHL teams over the last five seasons and their total points percentages for all five years combined.
The worst bang for the bucks teams over the past five years? Buffalo, Calgary, Minnesota, and of course, the Maple Leafs. This shouldn't surprise you.
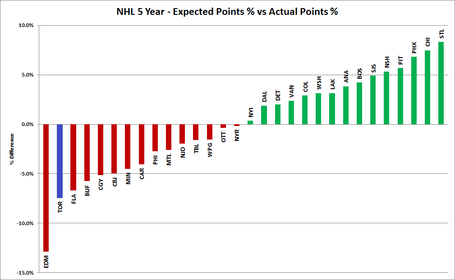
Going further, since we have a pretty good trend for performance versus spending, we can establish an expected pts% for each team and then compare that to their actual performance. So how did the Leafs fare in that regard? Shitty.
Like second worst only to the abysmal Edmonton Oilers, shitty.
This graph really highlights some of the better run teams in the league; St. Louis, Chicago, and Phoenix who nearly every year people can't believe perform as well as they do. On the other end of the spectrum, it's the teams we all know are run by morons; Edmonton, Toronto, Buffalo, and Columbus under Howson. In the middle, when we compare this graph to the first, we see teams that could really benefit from an owner with deeper pockets. Ottawa, the Islanders, and Tampa could all be perennial powerhouses is they weren't run by cheapskates, in terrible markets, or had easily accessible hockey arenas.
So what's the moral of this story? You gotta spend to win, but you also have to know how to spend wisely. The Toronto Maple Leafs under the guidance of Brian Burke and Dave Nonis were/are, without a doubt, one of the worst spenders in the NHL.


Comment Markdown
Inline Styles
Bold: **Text**
Italics: *Text*
Both: ***Text***
Strikethrough: ~~Text~~
Code: `Text` used as sarcasm font at PPP
Spoiler: !!Text!!