

Bill Daly said the NHL is getting younger and younger, and that turned out to not be true. In the next breath, he said that skill is off the charts, so does that hold up to scrutiny?
I am less skeptical of this statement, and not just because it's so vague. But if we just dial down the hyperbole of "off the charts" to "is going up in some sort of sustained way recently" then the only trouble with the statement is defining skill.
Every player in the NHL has skills, a lot of them, but not every player has the same skills. If all that statement means is that in the old days, which aren't all that long ago, the NHL hosted a lot of players with no meaningful impact on game outcomes then it's obviously true. Anyone who watched a hockey game as recently at 2000 can tell you that the NHL was rife with low-quality players who would not get an NHL contract today.
That major change in the NHL – due in large part to changes in officiating in 2005 as well as the professionalization of player evaluation and game analysis over the last 20 years – created a skill vs grit sloganeering meme that stops cold any understanding of what it means to grow skill in the game overall. Physical skills are skills! Defensive skills are skills! But as surely everyone knows by now, you can't measure them directly in a reliable way.
So what can we measure that might show skill level?
The point of hockey, you likely noticed, is to score more goals than the other team, so at the most basic skill-measuring level, we can just look at goal scoring rates across the league. Hockey Reference is where you get that, and their league averages are mostly per team per game.
| Season | GP | G | PP | PPO | PP% | SA | SV% |
|---|---|---|---|---|---|---|---|
| 2023-24 | 1312 | 3.11 | 0.63 | 3.02 | 20.98 | 30.1 | 0.903 |
| 2022-23 | 1312 | 3.18 | 0.65 | 3.07 | 21.31 | 31.1 | 0.904 |
| 2021-22 | 1312 | 3.14 | 0.6 | 2.89 | 20.61 | 31.4 | 0.907 |
| 2020-21 | 868 | 2.94 | 0.57 | 2.89 | 19.78 | 29.8 | 0.908 |
| 2019-20 | 1082 | 3.02 | 0.6 | 2.97 | 20.03 | 31.3 | 0.91 |
| 2018-19 | 1271 | 3.01 | 0.58 | 2.92 | 19.78 | 31.3 | 0.91 |
| 2017-18 | 1271 | 2.97 | 0.61 | 3.04 | 20.18 | 31.8 | 0.912 |
| 2016-17 | 1230 | 2.77 | 0.57 | 2.99 | 19.1 | 30.1 | 0.913 |
| 2015-16 | 1230 | 2.71 | 0.58 | 3.11 | 18.66 | 29.6 | 0.915 |
| 2014-15 | 1230 | 2.73 | 0.57 | 3.06 | 18.66 | 29.8 | 0.915 |
| 2013-14 | 1230 | 2.74 | 0.59 | 3.27 | 17.89 | 30 | 0.914 |
| 2012-13 | 720 | 2.72 | 0.61 | 3.32 | 18.22 | 29 | 0.912 |
| 2011-12 | 1230 | 2.73 | 0.57 | 3.31 | 17.31 | 29.7 | 0.914 |
| 2010-11 | 1230 | 2.79 | 0.64 | 3.54 | 18.02 | 30.3 | 0.913 |
| 2009-10 | 1230 | 2.84 | 0.68 | 3.71 | 18.23 | 30.2 | 0.911 |
| 2008-09 | 1230 | 2.91 | 0.79 | 4.16 | 18.95 | 30.1 | 0.908 |
| 2007-08 | 1230 | 2.78 | 0.76 | 4.28 | 17.75 | 29 | 0.909 |
| 2006-07 | 1230 | 2.95 | 0.85 | 4.85 | 17.58 | 29.5 | 0.905 |
| 2005-06 | 1230 | 3.08 | 1.03 | 5.85 | 17.68 | 29.9 | 0.901 |
What do we see? First, what you don't see is the year prior to 2005-2006 when Goals were 2.57 per team per game. That big jump with the new officiating style gradually degraded and then has skittered up from 3 fairly recently. Note the weird results from the Covid season. Save % (naturally) goes up and then down in lockstep. Which brings us to the first problem with measuring skill. Is it goalies, defence or offence driving the changes numbers like this show?
PPO stands for Power Play Opportunities (not the same thing as number of penalties), and while it treats 10 seconds the same as five minutes, it's still interesting to see that the big jump in PPO has tailed right down to about 3 and stayed there for years. However PP% first went up and then stalled at 20% over this period as PP styles evolved. SA is SOG Against, and it is very interesting how stable that number is.
If you study these numbers you can make up a bunch of theories and stories. I was briefly captivated by how the PP goal rate stays near .6 no matter the PPO level. And that cloud looks like a bunny. What you can get out of this is an understanding that hockey is a very complex system when looked at at the league level. Skill levels change, game styles change, players adapt, the rules adapt, and it's a living thing, not a static set of numerical relationships.
We can't look at just goals scored league wide because the refereeing affects that a lot. We can't look even at five-on-five goals because minutes played isn't constant. We can look at goal rates, but have we measured shooter skill or goalie effectiveness? (The answer is both.) I just made the argument in about six different ways here for the use of Expected Goals, but sometimes it's good to remember why that concept exists.
Expected Goals is all unblocked shots counted up and then weighted by a variety of factors notably shot location and type. It is limited by what the NHL records, and gives you the probability of any given shot becoming a goal against league-average goaltending. I would love to go back to 2005 for this part, but we can't. Shot location began being recorded in 2007.
All Situations Expected Goals per 60 Minutes
| Season | Mean xGF/60 |
|---|---|
| 23-24 | 3.23 |
| 22-23 | 3.24 |
| 21-22 | 3.00 |
| 20-21 | 2.72 |
| 19-20 | 2.84 |
| 18-19 | 2.86 |
| 17-18 | 2.86 |
| 16-17 | 2.73 |
| 15-16 | 2.69 |
| 14-15 | 2.63 |
| 13-14 | 2.62 |
| 12-13 | 2.56 |
| 11-12 | 2.61 |
| 10-11 | 2.69 |
| 09-10 | 2.69 |
| 08-09 | 2.67 |
| 07-08 | 2.53 |
Ah ha! Skill increase. Wait. Or is that a decline in defence? Because for every Expected Goal For someone is experiencing an Expected Goal Against, so is this just defence lagging behind offence? You're still winning the race if the field starts to falter, but that doesn't mean you're accelerating.
What this is, though, is the appearance of more offensive skill which translates to fan enjoyment. Which is good.
Another thing we can measure is individual players' Expected Goals. But that's fraught with the same questions, is it them and their offensive systems or is it the defensive systems? Let's look anyway with that in mind.
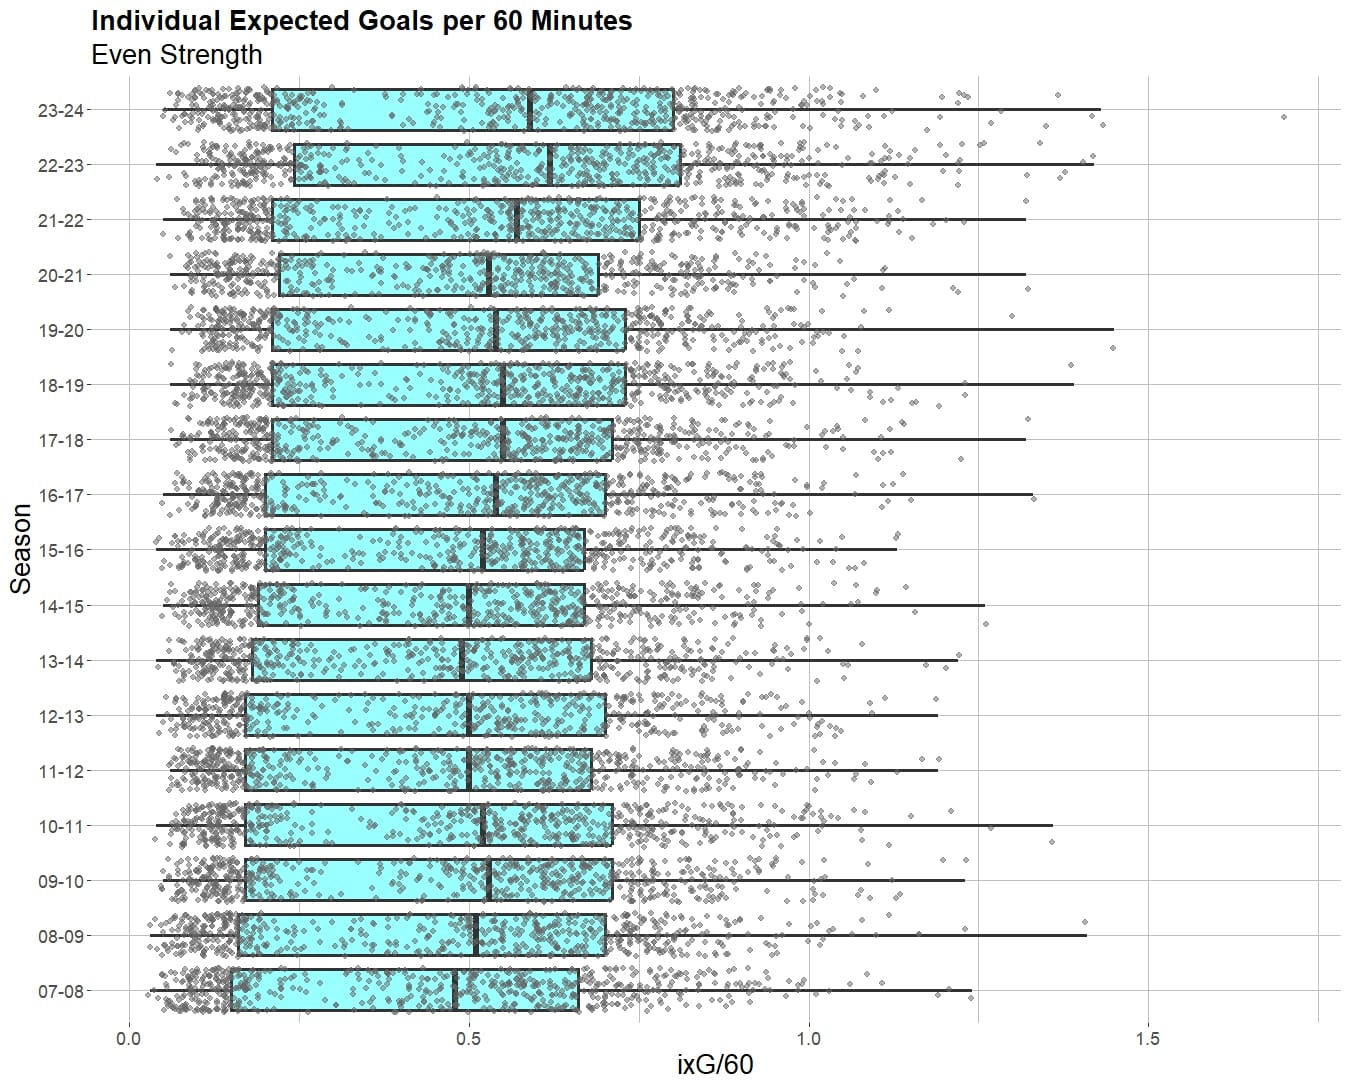
This is a lot of stuff, but then there's a lot of players. So what you are seeing here is one dot for the ixG/60 of each player who had at least 300 minutes played in a season. The blue boxes show you the area half the results are in. The dark line in the middle is the mean, and the left is the 25th percentile and the right is the 75th percentile. The long lines mark out the full extent of where all the dots land (except for last year where Zach Hyman is an official outlier).
The mean isn't moving around a lot, although the last three years have been the highest with a shift in the 75th percentile mark as well. Will that carry on? No way to know. There is a slight move to the right (better) in the very bottom end but last year saw some backsliding there. That interesting blank area that exists between those who never shoot and those who at least try is moving a little bit to the right as well. At the very top end the sprinkles of elite shooting are moving further to the right. In the very good range, so just to the right of the blue box, there also is a trend of more people (dots) in the region between 1 and 1.25 ixG/60.
I was concerned this might just be showing changes in shot volume so I looked at Expected Shooting % too, which removes that from the picture, and it's very similar.
The two types of skaters are completely separated in last year's results by that blank area. If I had to narrativize this, I would say that the minimum acceptable offensive ability of a player who isn't there for some other reason (those guys are the group to the far left) is rising. Meanwhile the top end of the quality scale is both improving and growing in numbers of players hitting those levels.
That growth at the elite end is the least likely to continue. There's only so close to perfection anyone can become. And the other thing is, I'm not sure exactly how much this translates into how you feel watching the game, but doesn't it seem like there should be more wow moments and less total nothingness if there are more individuals hitting the 1.5 ixG/60?
Wow moments mean goals. And this is how you get more of those wow goals without a meaningful increase in scoring overall.
| Season | G/60 over 1 |
|---|---|
| 23-24 | 73 |
| 22-23 | 84 |
| 21-22 | 94 |
| 20-21 | 68 |
| 19-20 | 67 |
| 18-19 | 72 |
| 17-18 | 49 |
| 16-17 | 51 |
| 15-16 | 42 |
| 14-15 | 43 |
| 13-14 | 38 |
| 12-13 | 45 |
| 11-12 | 52 |
| 10-11 | 52 |
| 09-10 | 50 |
| 08-09 | 61 |
| 07-08 | 44 |
The number of players hitting a G/60 rate over 1 at even strength is larger than it's ever been. The extremely elite numbers are small, and those mega-stars have always existed over this period, but there are now, consistently more players in the tier below. They're coming at the expense of middle ranked players, not the worst because the worst players are mostly defencemen. The number of people who score a lot and are therefore fun to watch is a lot higher than it used to be.
If there's an obvious skill increase at even-strength, to me it's in that area of near-elite goal scoring and in the increased Expected Goals, and that increase is almost entirely an increase in shot quality. as the increase in overall shooting is irregular and very modest over this period. The recent increases in goal scoring might be enough of a trend that the league average will move off the number 3 and into genuinely higher scoring rates all the time. That's impossible to say right now.
What underlies all this search for skill is that if all the NHL players of all kinds gradually improve, the result is status quo in terms of goal rates. If you start running faster, but so does everyone else, you aren't increasing your lead. When you really notice skill improvements is when they come at the expense of other players. The great goalie revolution, the death of the enforcer, and the recent growth in puck skills in defenders are some examples of changes that have been easy to see from your sofa. Most people would say they've noticed the change in the nature of offence as well, which is measured here as increased shot quality.
What isn't obvious is how much overall defending has improved to counter the better offensive systems and player skill. What can't be guessed at is where this is going in the future. Although it's more likely that the areas with the most room for improvement are where you'll see changes.
Is skill off the charts? Compared to when Bill Daly and I were young, you bet it is. Compared to 20 years ago? Well, things are looking up, I'll say that for sure.


Comment Markdown
Inline Styles
Bold: **Text**
Italics: *Text*
Both: ***Text***
Strikethrough: ~~Text~~
Code: `Text` used as sarcasm font at PPP
Spoiler: !!Text!!