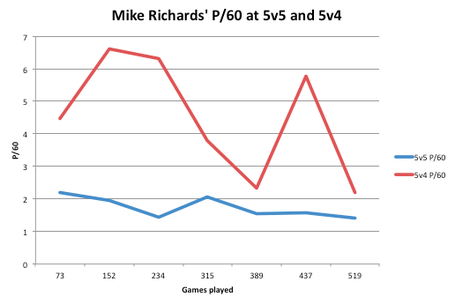
Ever since Mike Richards found himself playing on the Los Angeles Kings' 4th line, people have been puzzling over what happened. In some of the darker corners of the internet, trade speculation started to spring up, and it even caught fire with certain mainstream media members. Others (linked in the THN article) have wondered if the Kings would use a compliance buyout on Richards to free up some cap space.
If he is indeed bought out, many teams in the league will undoubtedly at least kick the proverbial tires. Richards is still good for half a point per game, and has been top-10 in Selke voting no less than 4 times, once finishing second only to Pavel Datsyuk. The multi-million-dollar question is, what does the 29-year old have left in the tank?
Although the first two seasons of his career aren't available at Behind The Net (the NHL simply didn't publish the requisite info to make these stats at the time), we can still see a pattern unfolding in his career 5v5 numbers:
| SEASON | TEAM | GP | TOI/60 | Corsi Rel QoC | Corsi QoC | Corsi Relative | Corsi On | On-Ice Sh% | Pens Taken/60 | Pens Drawn/60 | Off Zone Start % | Off Zone Finish % |
| 2007-2008 | PHI | 73 | 12.62 | 0.468 | 0.173 | 4.7 | -3.84 | 10.44 | 0.9 | 2.2 | 31.5 | 43.5 |
| 2008-2009 | PHI | 79 | 14.13 | 0.948 | 0.179 | 1.1 | -3.6 | 10.2 | 0.8 | 1.3 | 40.2 | 47.1 |
| 2009-2010 | PHI | 82 | 14.09 | 0.811 | 0.354 | 4.6 | 5.3 | 7.44 | 0.7 | 1.8 | 46.8 | 50.1 |
| 2010-2011 | PHI | 81 | 13.26 | 0.752 | 0.567 | 1.1 | -1.23 | 8.74 | 0.9 | 0.9 | 46.8 | 50.1 |
| 2011-2012 | L.A | 74 | 13.08 | 0.909 | 0.416 | -15.4 | -3.29 | 7.6 | 1.1 | 0.9 | 50.2 | 51.6 |
| 2012-2013 | L.A | 48 | 11.84 | 0.611 | -0.4 | -6.6 | 7.81 | 8.33 | 0.6 | 0.7 | 55.8 | 52.4 |
| 2013-2014 | L.A | 82 | 11.98 | 0.616 | -0.338 | -4.1 | 11.61 | 5.94 | 0.5 | 0.9 | 58 | 55 |
Richards' shifts have been starting in the offensive zone with increasing regularity each season while most of his possession numbers have been slipping. Not good. the other (related) problem, of course, is that Richards isn't scoring like he used to, and so poor possession stats (at least relatively poor on the best possession team in the league) now mean his value is extremely limited.
That Richards' production has been in steep decline since the age of 24 is curious. Of course, NHL players' peak offensive production age is roughly 25, so a lot of folks are inclined to simply shrug and say that some players fade earlier than others. Two things separate Richards from the herd in this regard: 1) he was an elite scorer and those players tend to fade more slowly, and 2) his decline is noticeably more than most. Could it be, as Justin Bourne speculated in the above-linked article, that Richards' physical style is the cause of this? My guess is 'no', particularly because Richards hasn't spent all that much time being injured (the 2006-07 season being the exception).
I actually don't think we need to dig much deeper than we already have in order to understand Richards' drop in production. Take a glance at this table:
| Team | Year | Age | GP | Total Points | EV Points | PP Points | PP Point% of Tot |
| PHI | 2005-06 | 20 | 79 | 34 | 28 | 6 | 0.176 |
| PHI | 2006-07 | 21 | 59 | 32 | 26 | 6 | 0.188 |
| PHI | 2007-08 | 22 | 73 | 75 | 44 | 31 | 0.413 |
| PHI | 2008-09 | 23 | 79 | 80 | 47 | 33 | 0.413 |
| PHI | 2009-10 | 24 | 82 | 62 | 31 | 31 | 0.500 |
| PHI | 2010-11 | 25 | 81 | 66 | 45 | 21 | 0.318 |
| LAK | 2011-12 | 26 | 74 | 44 | 30 | 14 | 0.318 |
| LAK | 2012-13 | 27 | 48 | 32 | 26 | 6 | 0.188 |
| LAK | 2013-14 | 28 | 82 | 41 | 29 | 12 | 0.293 |
Judging by this table, it looks like although yes, Richards' even strength production is in decline (there is no question that he himself is in decline overall) his power play production has taken a disproportionately bigger hit, and it's not because of a lack of ice time. Last season, Richards had the 4th most power play time of any forward on the team. Sure, his 2.67 minutes/60 of this past season isn't quite the 3.10/60 he had back in 2008-09 on Philly's top unit, but it's not drastically less.
The final column in the chart above that shows the percentage of Richards' points scored on the power play is telling. If Richards was able to maintain the same rates of production on the power play, his overall numbers wouldn't look so bad. Of course, you need only to recall Bryan McCabe's big three offensive years to remember that once teams figure out your tricks on the man advantage, it's not long before start getting shut down completely.
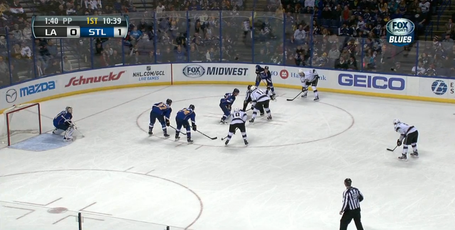
Of course, the downward trend in Richards' power play production can perhaps also be attributed to a shift in usage. Here is a shot of him playing left wing on a power play on January 2nd of this year (he's number 10 on the near side):
Here, on November 8th of 2013, Richards is on for a 4-on-3 (that did eventually score) where he lined up on the right side. It appears from their setup that he's been designated to play the point (far side, in possession of the puck):
On this particular 5v4 against Pittsburgh on April 21st, 2009, Richards is in the middle of the ice between Brière and Hartnell. 2008-09 was Richards' most productive season overall, as well as his most productive on the power play.
Next, we have a shot from March 27th, 2010, the season where he scored the largest percentage of his points on the power play, 2009-10. Here, Richards is back to left wing.
Mike Richards is getting worse earlier than everyone expected, and there's no hiding from that. His current contract tells you all you need to know about what people expected of him at this point in his career. So yes, his production has fallen off, but a lot of our expectations may have been based on a few hot (read: lucky) power play seasons that came earlier in his career than they do for most. You have to wonder though: would his production increase if he switched back to C on the power play?


Comment Markdown
Inline Styles
Bold: **Text**
Italics: *Text*
Both: ***Text***
Strikethrough: ~~Text~~
Code: `Text` used as sarcasm font at PPP
Spoiler: !!Text!!