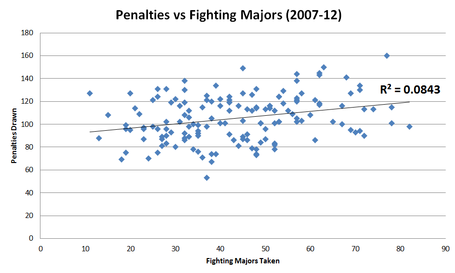
In my post about fighting majors versus non-obstruction penalties drawn I said that I'd update it once I got the rest of Dirk's data which I got last night. I've update the spreadsheet here and below you can see the graph of penalties drawn vs fighting majors taken for the seasons 2007-12. (I excluded 2012-13 because it was only 48 games long and I didn't want to prorate the numbers.)

That's 150 data points which do not at all support the argument that fighting deters dirty business in hockey.
Links
A Graphic Guide to Advanced Hockey Stats
This is probably the best article regarding advanced stats that you're ever likely to come across. Everything is neatly explained and there are some pretty picks and graphs for the Ottawa Senators fans to look at too.
Old School Thinking and Modern Day Analytics
DGB thinks the Leafs are going to make it go boom.
Did Jason Botchford cross the line by reporting Thornton's "rooster" comments?
Article from Puck Daddy
Anything you can do I can do better
...Says Tomas Vanek. Again, article from Puck Daddy.
Game Recaps


Comment Markdown
Inline Styles
Bold: **Text**
Italics: *Text*
Both: ***Text***
Strikethrough: ~~Text~~
Code: `Text` used as sarcasm font at PPP
Spoiler: !!Text!!