Hi everybody, long time no type.
I haven't posted on PPP since May 8th - I've been busy with work, family, and working out as many of the kinks as feasible with my stat dCorsi... which is relatively ready for the light of day (I posted about it at NHLnumbers on Saturday). Here's a discussion of what it is, what it isn't, and what we can use it for.
What Is dCorsi?
dCorsi stands for "delta Corsi". Our friendly neighbourhood Frag (Andy) first coined the term when making suggestions on how I could improve my SDI statistic. Here we are using delta to represent differential, specifically the differential between a skater's Expected Corsi and Observed Corsi. Everyone reading this should have a handle on what Corsi is by now - if you don't, then I suggest you go read this before continuing.
The differential between Expected Corsi (as determined by regression) and Observed Corsi depends on the "usage effects" explained by Expected Corsi - this is what you'd expect out of a perfectly average player in an average season if he was handed the same minutes with the same players against the same opposition. The other half of this coin is what the player in question does with their minutes. How do the shot differentials work out and how far away is it from the expected result?
In an individual year the number will shift due to random factors and effects but over time (particularly multiple seasons) a lot of this washes away and you're left with a pretty solid measure of player skill relative to their usage.
Now that we're all up to speed on what Corsi is (also known as shot attempt differential) and what dCorsi is supposed to describe, let's think about what the issues are around how we've used Corsi to date.
*IF YOU ARE INTERESTED IN A MORE TECHNICAL DOCUMENT DESCRIBING THE CORRELATION CLICK HERE*
Issues Presented By Current Analysis Methods
Corsi is best used as a proxy representation of puck possession. It also correlates relatively highly to future GF% and thus as a result winning. This is important because the high number of events that go into the measurement are less rare and thus the results are more repeatable over the long term. In other words, guys who are good at puck possession generally will post better Corsi results than guys who are bad at puck possession.
There are outside factors that impact upon Corsi. We have adjustments for a bunch of them. Zone Starts and Faceoffs? Yep. What other things affect Corsi? Winning or Losing faceoffs. How about the effects of teammates or the team system itself? Well for that we use Corsi REL (apologies for linking to HEOTP)... but that has its own potential problems.
So how do we deal with the issues presented by these outside factors? Well we have adjustments for all of the above and we also adjust for other situations like game state (i.e. score effects). The problem that arises with all of these various adjustment factors and distinct statistics is that it becomes amazingly onerous to delve into comparison between players on the same team, let alone across the NHL.
What we really need to do this is a way of account for player usage. This has been accomplished to date largely through visual representations such as Player Usage Charts. There are also visualizations that let you look at a skater's Expected Goal output based on data like shot location and type.
Rather than work through a huge variety of individual statistics, which frankly many people don't have a) the time for, or b) a concrete understanding of, it would be very useful to have a meaningful way of comparing players in similar contexts and see who gets the best results.
Genesis of dCorsi
A few years ago I was trying to wrap my head around how we could assess the defensive ability of skaters statistically. I know goals don't do a very good job of representing defensive play largely due to goaltending impacts and the high variance of the events being tracked. Thus we're back to impacts on shot differential but to date there aren't obvious ways to compare defensive usage across the NHL. How do you compare a player's impact on defensive shot attempts against? We have WOWY charts to compare how other skaters do with and without a guy on the ice. We have Corsi REL and Fenwick REL. But do these really account for "usage" in a meaningful way?
Initially I played around with estimated factors to adjust for usage - starting from the style of model I had seen used by Tom Awad back when he was sorting out delta SOT, and initially I came up with SDI. Remember that this was being developed 2 years ago... this idea isn't brand new. Anyway - I played around with the numbers and eventually I realized I was basically making stuff up as I went along (or felt like I was) and it bothered me.
Rather than continuing to pull numbers out of thin air - I decided it made far more sense to actually use a regression to assess the impact of the various factors. So that's the approach I started to take. I ran a multi-variate linear regression between Corsi and a whole host of variables... a lot of variables, that may or may not have had an impact.
*(all component statistics are sourced originally from the NHL via BehindTheNet.ca, stats.hockeyanalysis.com, and hockey-reference.com)
In the end, the ones that were most significant went into the formula for Expected Corsi. The regression had an r^2 of around 60~63% for Corsi For and Corsi Against individually. When you combined them into a single Corsi number, you get an r^2 of about 54%. This means that the regression - all of those OUTSIDE factors - are explaining about 54% of what you see on the ice.
The formula is not small - it is not a nice and tidy simple formula that just anyone would bother with. Because of the team-factors effects it actually has 58 variables just for the different teams in the NHL (29 for Corsi For and 29 for Corsi Against). Add in the various faceoff, zone start, teammate and quality of competition effects and you have another 8-10 variables thrown in that are accounted for. Then I also factored in the skater's age, their time on ice, and yep... you have around 70 different variables to account for. I ran the regression using the statistical freeware program R. (I also ran it using STATA - but the numbers I've settled on for now were run using R). This isn't a regression you can conduct in Excel, there are too many variables for it to keep track of.
So since this is sort of a beast of an equation and I don't expect the majority of people to actually want to sit down and comb through the underlying detail of the mathematical justification I won't post all of that on here (but it IS in the paper I link to at the top and the bottom of this posting).
*A brief aside on the topic of Team Effects. Another method I originally contemplated using was dCorsi REL - and in fact at one point earlier in this process I tabulated it (it has also gained traction on twitter to some extent). Unfortunately there are issues when it comes to comparing players who do not spend an entire season with a single team. I actually decided to strip those players from my analysis entirely because of how they were confounding the data. I instead chose to go the fixed team effect route (which is not actually ideal as discussed in the detailed paper). This is an area of continuing interest and is something that I am trying to sort through. I have an updated version of the regression with yearly team variables by season, and it shows a marked improvement in the correlation between Expected and Observed Corsi (53% increases to 68%). I will publish more info on this when I complete a more detailed analysis.
Here's the short version of the results of interest so far:
1. dCorsi IS fairly repeatable.
Moreso than stats like SV% or SH%. We consider SV% and SH% to be skills because we know skaters that post a high SH% or SV% are likely to do so again in the future. We also know that the "average" skater or goalie will still see some pretty wide variation year over year in these numbers but this doesn't surprise us and we seem to be ok with it.
If a guy posts good dCorsi numbers at a certain level of Expected Corsi (i.e. in 2nd line minutes or against top competition etc.) - then he'll probably do so again if he's given those same minutes in the future. Conversely, if a guy performs poorly in his minutes and posts a bad dCorsi at a certain level of Expected Corsi then he probably will do so again in the future.
2. dCorsi is normally distributed.
What this means is most guys hover around zero... the vast majority of NHL players in fact fall within a fairly narrow range. These guys generally are playing the role you want them to and their coaches are using them appropriately (with the caveat that usage should change more than it does - see #5). That being said, at the extreme ends are guys that perform WELL below and WELL above expectations in terms of shot differential - and they do so regularly.
3. The top players in dCorsi over the long term are the top players in the NHL in terms of possession.
They are the best defenders, and the best forwards at keeping the puck away from the other team/getting it back. These are likely the guys that should be getting nods for the Norris or Selke every year. They're the ones driving play in a positive direction year after year. The Bergerons, Charas, Williams, etc. of the world are the guys in this region.
4. The bottom players in dCorsi over the long term are an interesting group.
It seems to be a mix of guys cast as follows: (a) in the role of "defensive stopper" who are actually atrocious at stopping anything (think Michal Handzus, Gregory Campbell, etc.); (b) guys typically presented legitimately as top scorers (many of whom get a LOT of points on the PP); or (c) guys who are basically punching bags with cement hands that don't belong on an NHL roster. Group (b) is the most interesting of this group to me and definitely warrants further study. I'm curious to see if there is something going on with their personal or on-ice SH%. I also think it's likely that their offensive abilities compensate for some atrocious defense and thus poor possession numbers.
5. Expected Corsi is more repeatable than actual Observed Corsi. dCorsi is less repeatable than either of the other two.
This makes some level of sense, and it explains something we've all probably noticed. Coaches keep throwing players out in the same situations even if they are declining or improving in their play. They don't shift usage easily. Their 3rd period defensive zone guy they trust is going to be taking that important draw late in the game, even if the last time he was actually good defensively was 3 years ago when he played for that Cup contender. Similarly, that top line winger is going to keep lining up on the top line even though his production has dipped for 3 straight years. Everyone knows he's lost a step, and he isn't as productive as he was, but he plays the game "the right way" and there's nothing that can be done to shift that narrative for management.
There is also a slight negative correlation between Change in Expected Corsi year over year and Change in dCorsi Year over Year. This implies that SOME adjustment is taking place. In other words, on average, as a player's dCorsi increases their Expected Corsi decreases (they're played in tougher situations), or alternatively as their dCorsi decreases their Expected Corsi increases. The correlation is very low, so whether or not this is the case for the majority of players or coaching adjustments is debatable. It also hasn't been tracked within a single season so it's hard to describe this as a conclusive point.
If you want to read the full write up - it's 13 pages long including graphs, tables of players who do well and poorly based on the various stats mentioned, AND it has the weighting of the included factors used in the actual equation - then please go here.
WHAT dCORSI IS AND WHAT IT ISN'T
I just want to stress a couple of points. dCorsi is useful for evaluating players in context - particularly over the long term. If you wish to compare players in the best way possible using this data - compare players who have similar Expected Corsi values, i.e. players who have been used similarly.
Basically players with extremely high or consistently high dCorsi values are playing above their usage, while players with extremely low or consistently low dCorsi values are in over their head with respect to their usage. In either case, it should probably be adjusted if possible to improve how they are being used.
A team that is being used "ideally" would theoretically have a dCorsi of zero (which is basically impossible due to the randomness inherent in the sport of hockey).
dCorsi is NOT a Wins Above Replacement level statistic at this point. Do not confuse it for WAR. I personally prefer it to GVT at this point for sussing out players that are over-valued or under-valued but I haven't yet looked into how it compares to that statistic in terms of assessing player value.
What I would say is - I think there is meaning here - I think this is trending in the direction that gets at real underlying value of players without all the background noise we see in the game when we watch with our eyes. I'm also not the only person that thinks this. Here are some more comments from other analytics bloggers and writers who I have shared my preliminary work with on dCorsi:
"I think the biggest problem is the difficulty in correcting for team effects when analyzing individuals."... "there have been newer metrics recently introduced (dCorsi) that try to do this."
- JenLC, 2nd City Hockey
"Great stuff."
- Kent Wilson, NHL Numbers
"'Undervalued' is exactly the right word"..."And it's maybe the toughest analytic challenge out there (getting at this with PBP data alone)"
- Nicholas Emptage (discussing using dCorsi to assess player value), Puck Prediction
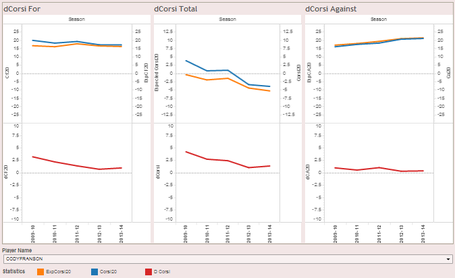
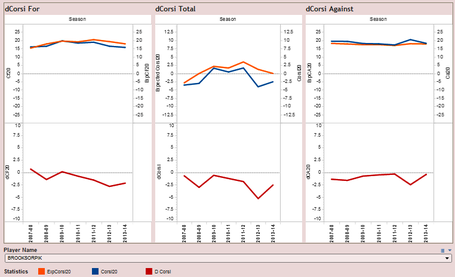
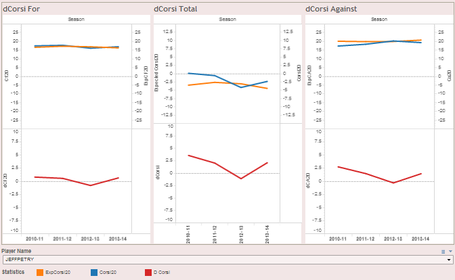
The paper is structured more as a formal research document than this blog posting, so if that doesn't interest you, but you wish to play with the results then feel free to use the Tableau Visualization I've created that lets you search NHL players by name. Some examples of it in action are shown below (click on the pictures to enlarge):
Cody Franson's dCorsi
and Brooks Orpik's dCorsi
and Jeff Petry's dCorsi. I wonder which one of those 3 is the most over-rated and an Olympian?
Also - here are the results from the most recent regression for the Toronto Maple Leafs from 2012-13. I will let them stand without comment for the moment aside from this ONE suggestion - perhaps the team's current leadership core of players MIGHT be more of a problem than many realize:
| Player Name | AGE | TOI | Corsi20 | ExpCorsi20 | dCorsi20 | dCorsi Impact |
|---|---|---|---|---|---|---|
| JAKE GARDINER | 23 | 1363.33 | -2.670 | -4.465 | 1.795 | 122.342 |
| CODY FRANSON | 26 | 1202.65 | -3.891 | -5.551 | 1.660 | 99.797 |
| TROY BODIE | 29 | 402.08 | -5.123 | -6.860 | 1.737 | 34.919 |
| DAVE BOLLAND | 27 | 271.65 | -4.270 | -6.375 | 2.105 | 28.588 |
| MASON RAYMOND | 28 | 1107.05 | -4.589 | -4.985 | 0.396 | 21.909 |
| PAUL RANGER | 29 | 778.52 | -5.626 | -6.115 | 0.489 | 19.044 |
| TREVOR SMITH | 28 | 263.80 | -6.596 | -7.175 | 0.579 | 7.634 |
| NAZEM KADRI | 23 | 1090.52 | -3.888 | -4.018 | 0.130 | 7.091 |
| MORGAN RIELLY | 19 | 1088.27 | -4.430 | -4.506 | 0.076 | 4.115 |
| JAY MCCLEMENT | 30 | 878.28 | -7.606 | -7.640 | 0.034 | 1.506 |
| COLTON ORR | 31 | 287.45 | -6.818 | -6.803 | -0.015 | -0.209 |
| DAVID CLARKSON | 29 | 821.32 | -5.893 | -5.693 | -0.200 | -8.213 |
| NIKOLAI KULEMIN | 27 | 919.35 | -6.374 | -5.917 | -0.457 | -21.024 |
| JOFFREY LUPUL | 30 | 1022.85 | -5.846 | -4.613 | -1.233 | -63.059 |
| TYLER BOZAK | 27 | 929.18 | -5.876 | -4.148 | -1.728 | -80.281 |
| JAMES VAN RIEMSDYK | 24 | 1257.75 | -4.850 | -3.547 | -1.303 | -81.924 |
| CARL GUNNARSSON | 27 | 1222.83 | -7.540 | -6.153 | -1.387 | -84.790 |
| PHIL KESSEL | 26 | 1342.03 | -4.799 | -3.515 | -1.284 | -86.182 |
| DION PHANEUF | 28 | 1286.25 | -7.246 | -5.854 | -1.392 | -89.540 |


Comment Markdown
Inline Styles
Bold: **Text**
Italics: *Text*
Both: ***Text***
Strikethrough: ~~Text~~
Code: `Text` used as sarcasm font at PPP
Spoiler: !!Text!!