I’m going to tell you how tall the NHL is these days. That seems straightforward enough, but there’s some things that will be very helpful to know before you look at the numbers.
The NHL is an American league, so they keep all their vital statistics data in Imperial Measurements. They also keep these statistics in a dynamic way. In other words, if you go look at an old Leafs roster on the official Maple Leafs website, it will show you whatever values are held in the NHL database today for that player. If you want historical information, you have to go dig for it. However, the amount that height measurements might change over the career of an NHL player is very small. You’ll find anecdotes of players whose NHL data dates from their NHL Central Scouting information, but once they make an NHL roster, it gets updated. Today is just about this season’s players, so we can be confident it’s accurate enough in the aggregate.
Almost all of the data kept on height around the world is in centimeters, and the NHL data we’ll see in a moment has been converted to total inches to do math on it. To help you convert on the fly if you need to, remember that one inch is 2.54 centimeters, so:
- 5’ or 60” is 152 cm
- 5’6” or 66” is 168 cm
- 6’ or 72” is 183 cm
- 6’6” or 78” is 198 cm
- 7’ or 84” is 213 cm/
How Tall are Ordinary Men?
Height data from around the world shows that men in the countries the NHL draws from have gotten taller over the last century, largely as a factor of improving living conditions, not genetics. This year-over-year change leveled out in the 1980s in most of the world. So for our purposes, everyone in the NHL, even Mark Giordano, was born well after the time men peaked. In height that is.
There is some variation in male heights regionally, with the Netherlands famously having the tallest people, but for the NHL of today, this isn’t a factor, as most countries NHLers come from are very similar:
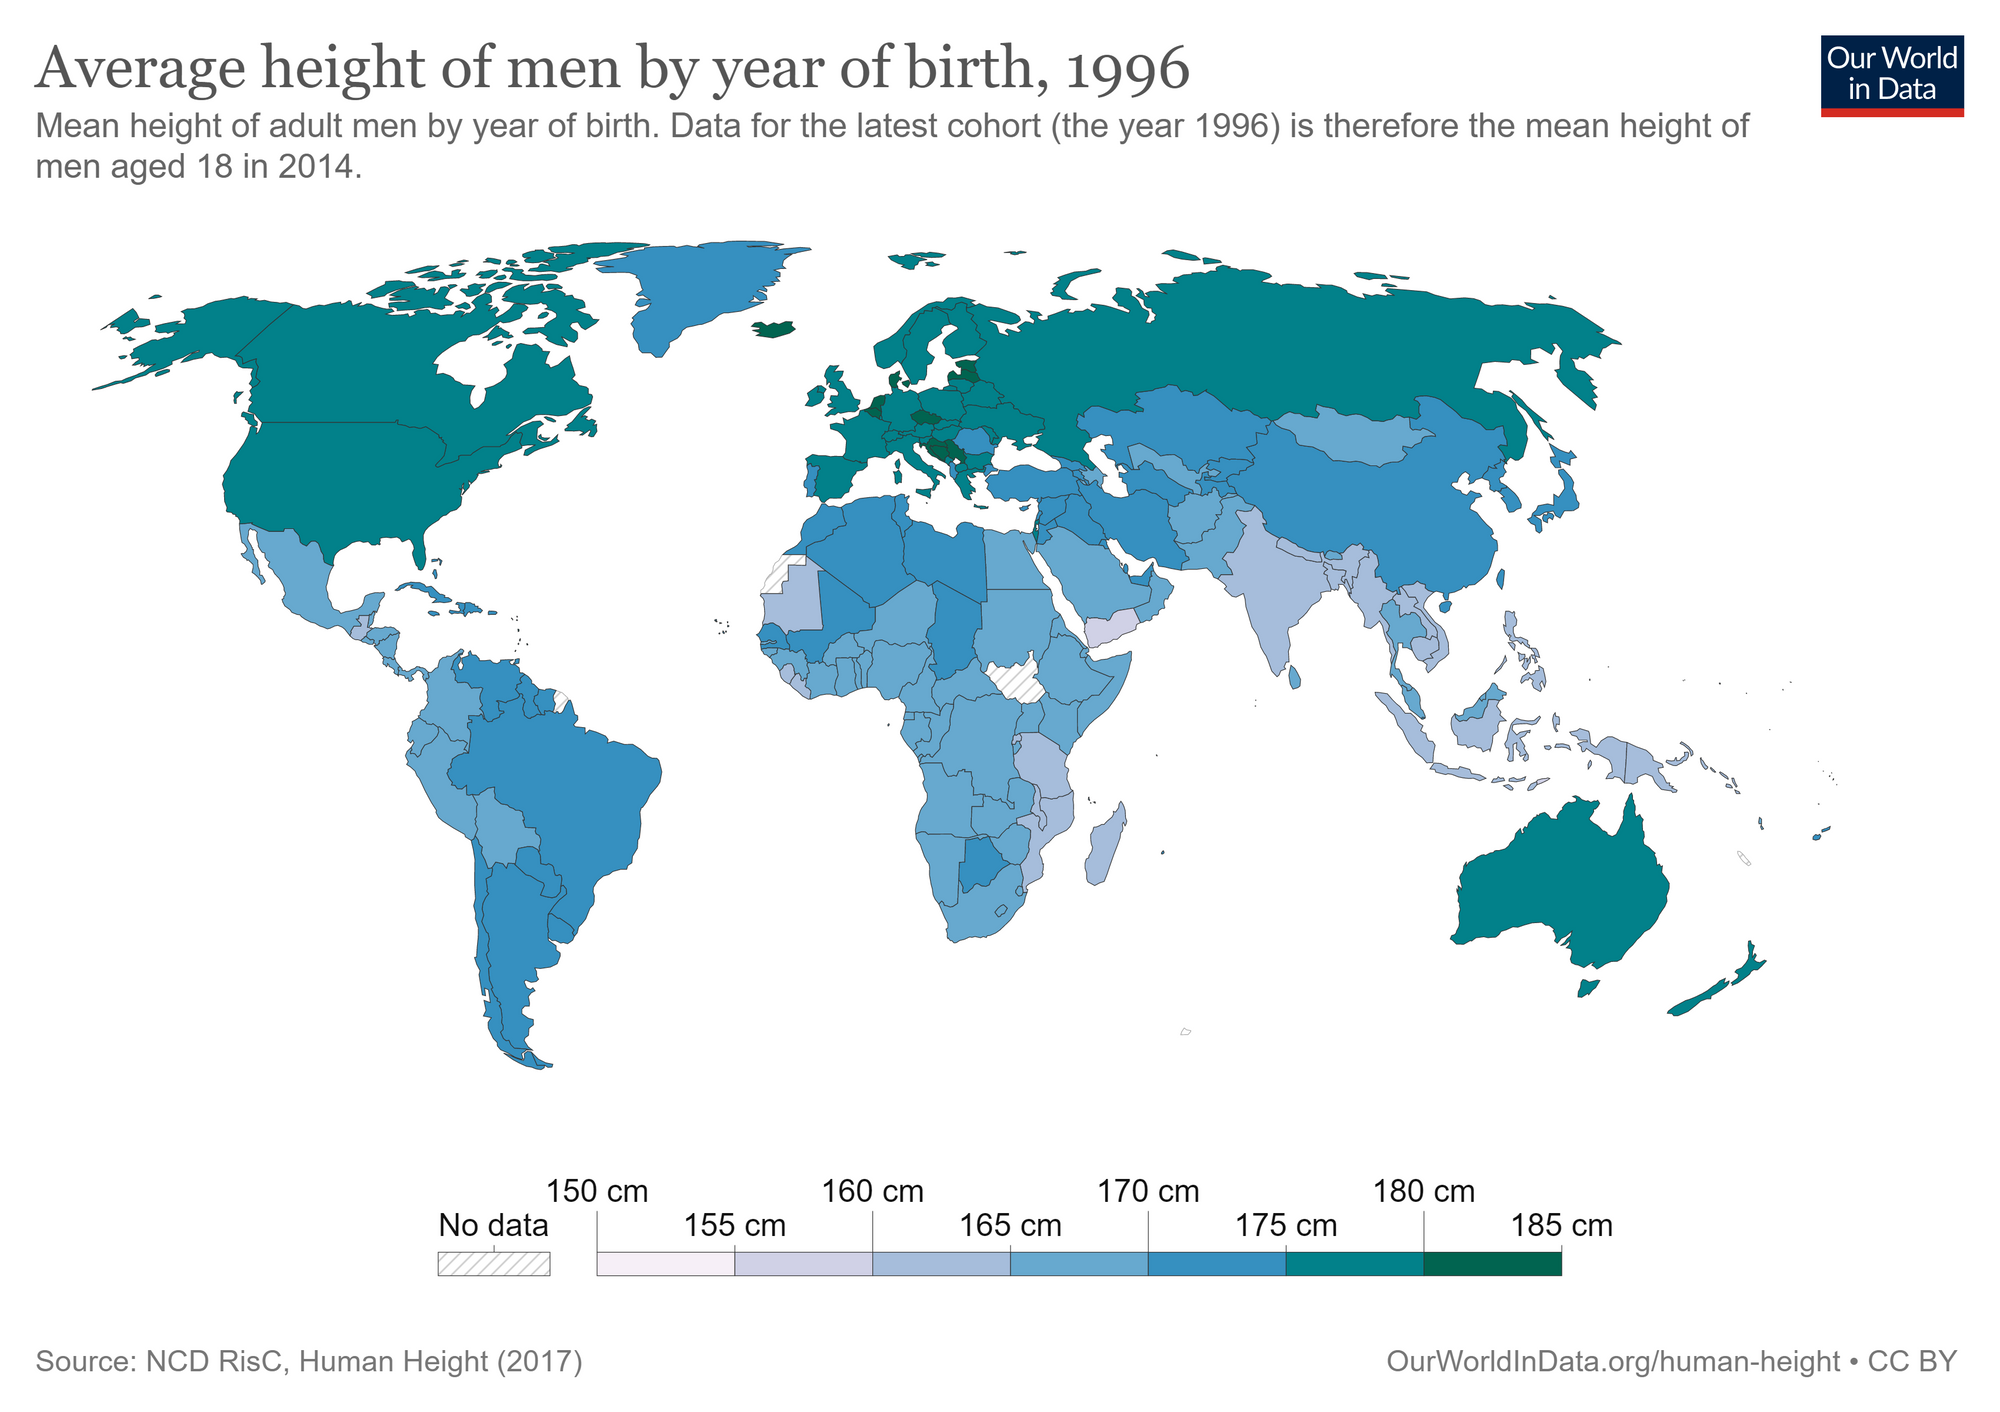
There are a very small number of countries that have a mean height over 180 cm, and two have sent players to the NHL — Denmark and Latvia. But the difference in mean height between Denmark and Canada is one inch.
To help understand the height of NHLers, I simulated some height data that uses the usual mean height of North American men and the usually observed standard deviation in inches to randomly generate 100,000 data points. This simulation represents well how tall men are in Canada and the USA:
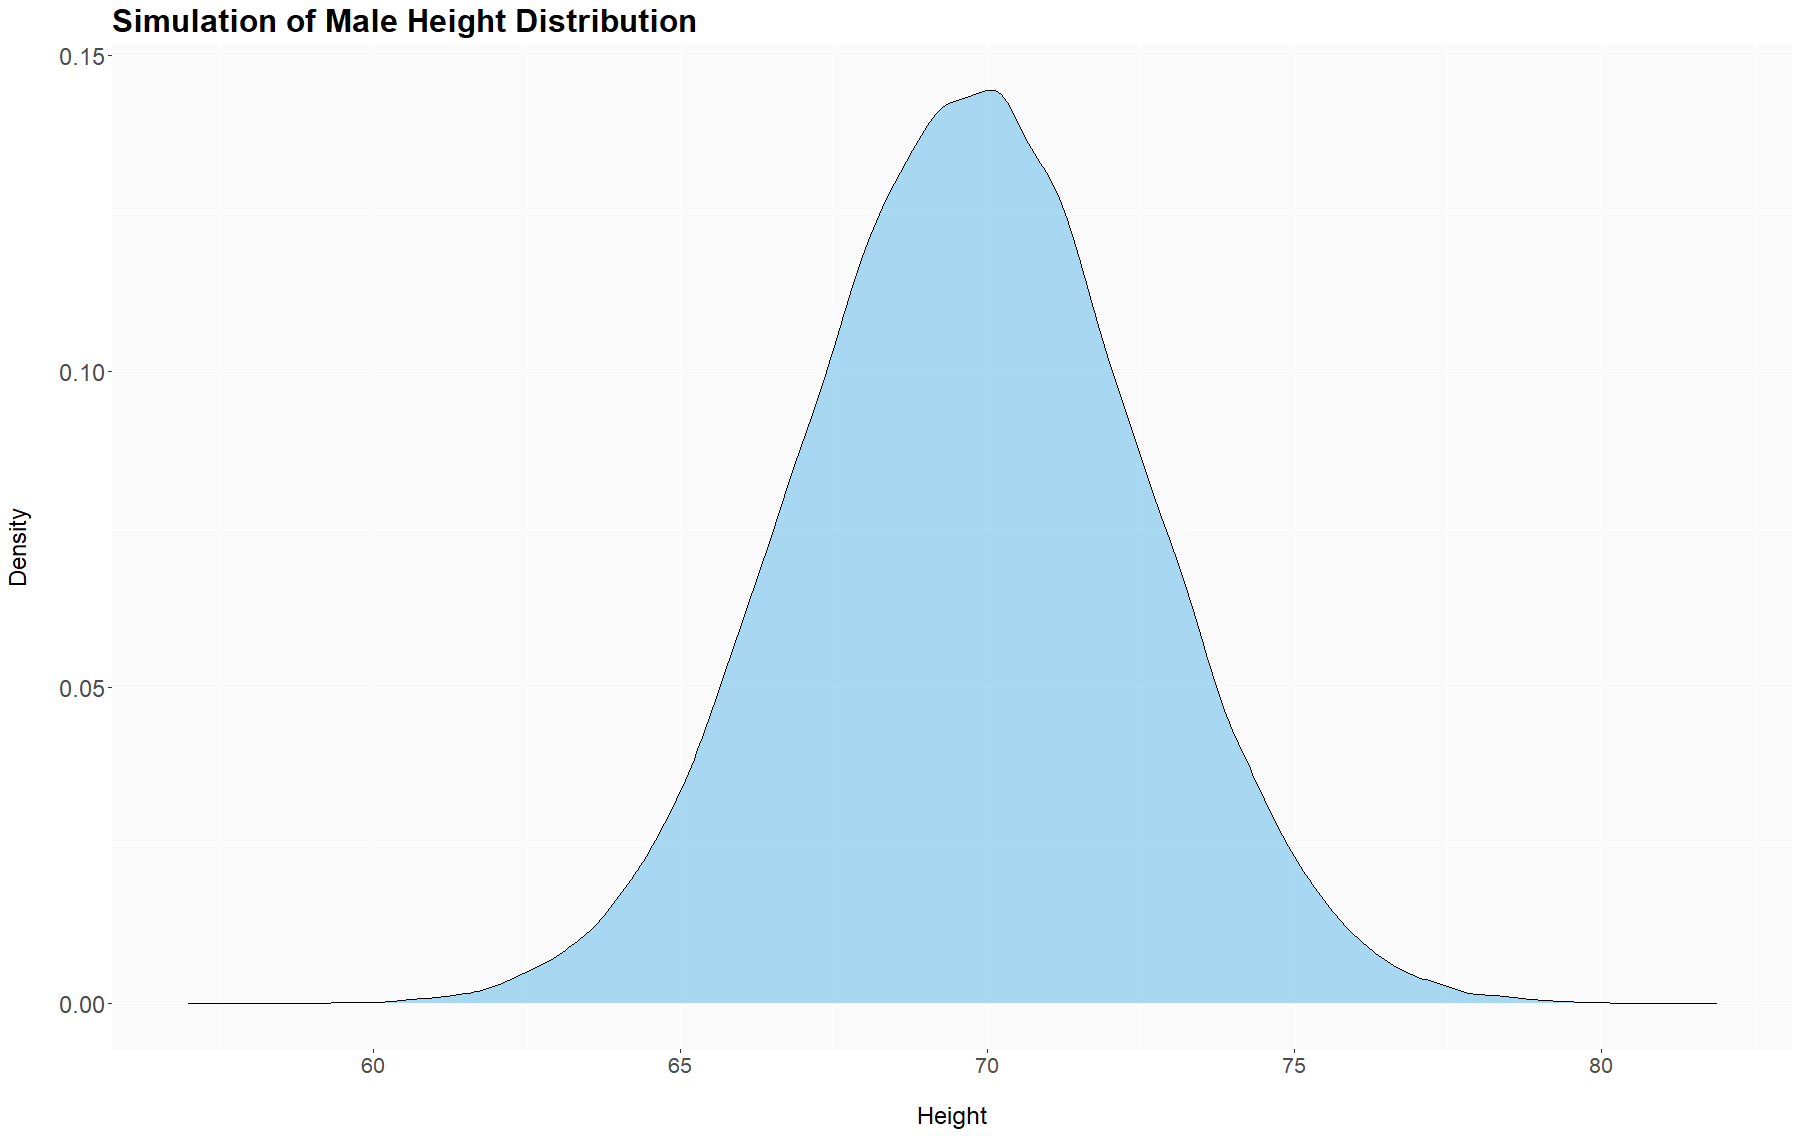
How to read a density plot: The height is in inches along the bottom, and the y-axis is the density or proportion of the total number of data points that fall at a given measurement.
The mean of this data is 69.7”, with 80% of men falling under the magic measure of six feet tall.
NHL Heights in 2022-2023
The NHL active rosters as of opening day contains just the players on IR or actively playing. That is approximately 23 players per team, and the full set of data contains information on 750 people. Like always, the first thing you have to do is exclude the goalies, leaving 676 skaters.
The mean of the full group of skaters is 73.2”, with the tallest player, Tyler Myers at 80” and the shortest, Cole Caufield and Alex DeBrincat at 67”. Compared to the set of men they come from, NHL players look like this:
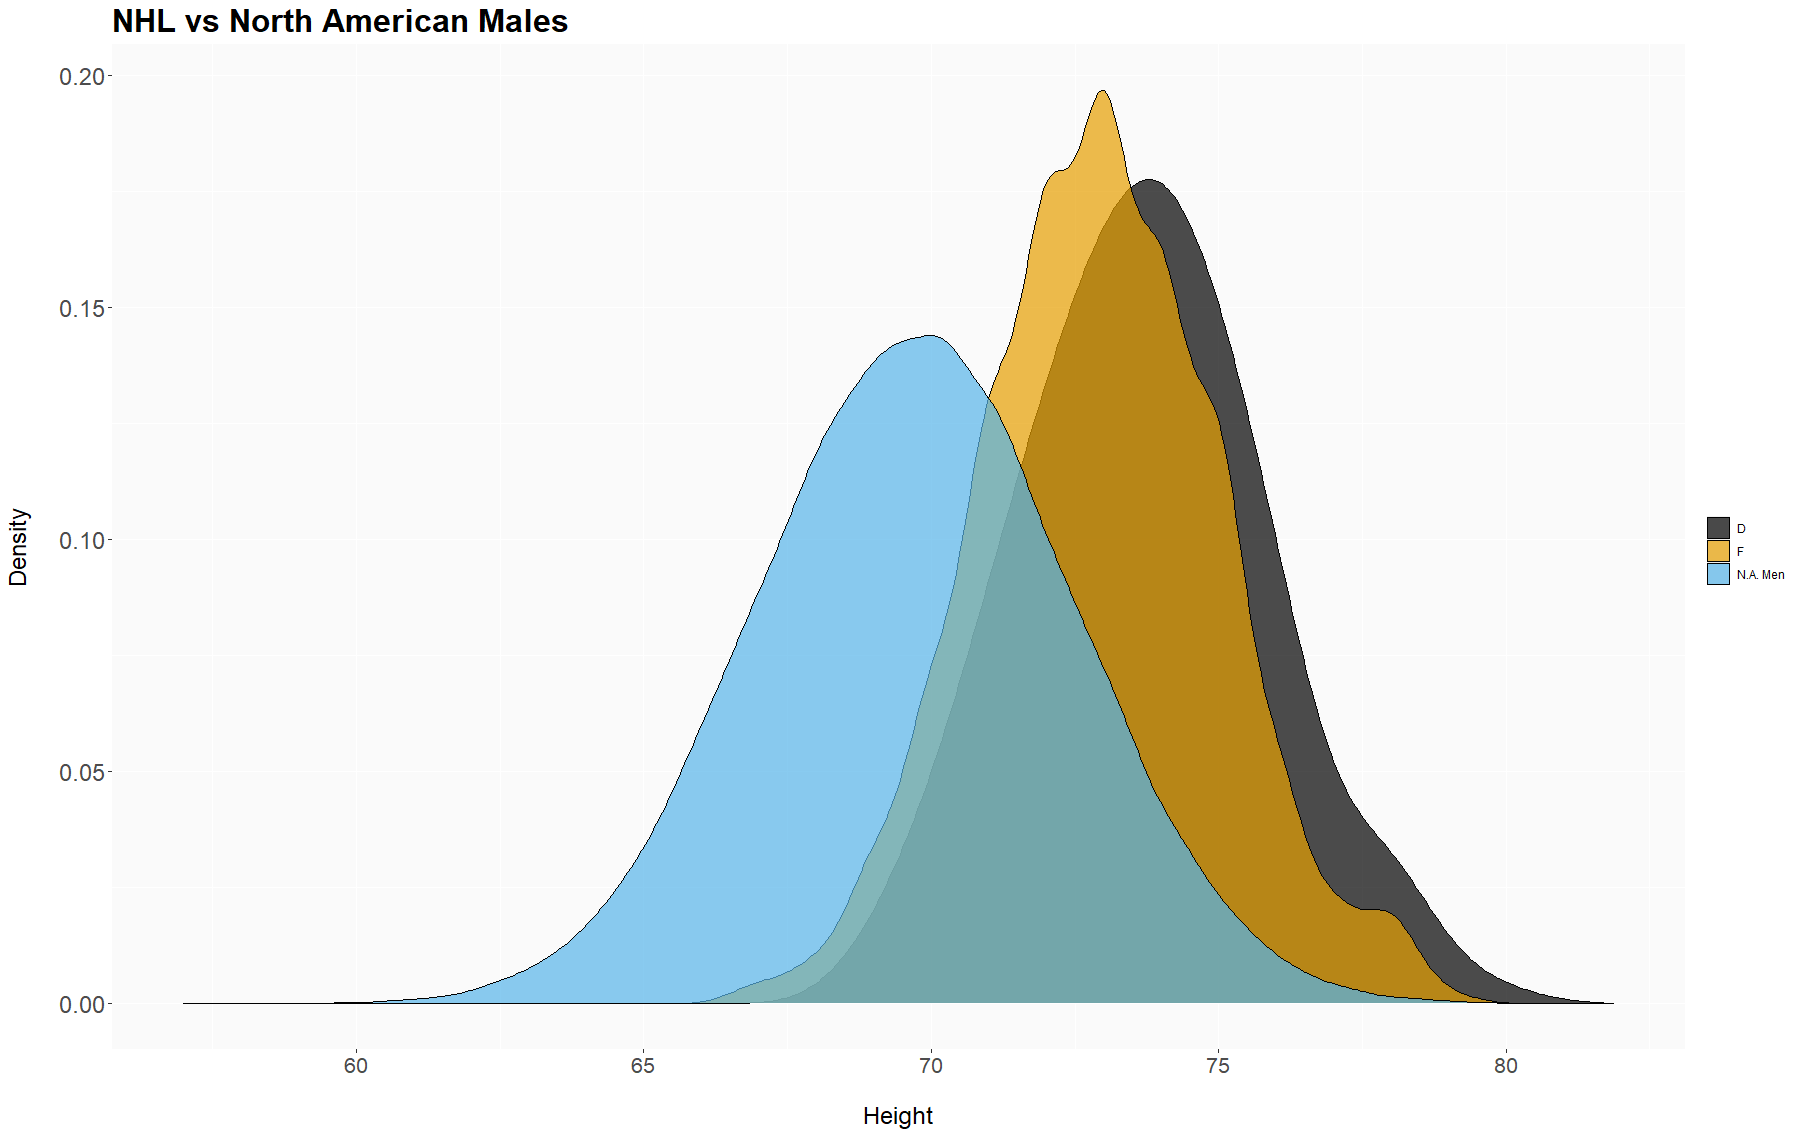
How to read this comparison: The blue density plot is the same as above, and it’s plotted against the NHL Defenders and Forwards. You can tell NHL players are taller than most men because the plots are farther to the right. The higher peaks tells you that more NHL players cluster around the mean than in the blue group and there is less variation within the group. The standard deviation is much smaller, closer to two inches rather than the 2.75” used for the simulation.
There is not a great deal of difference between forwards and defenders in the NHL. Defenders are a little taller at the mean as well as both tails, meaning the very shortest defenders are taller as well as the very tallest. But it is a little. The means are 73.7” and 72.9”, and notice that both are above six feet.
NHL Weights in 2022-2023
It’s not useful to compare the weights of professional athletes with anyone else, not even athletes in other sports. Comparing the distribution of weights by position can tell us the size of the NHL in a way that means something, though.
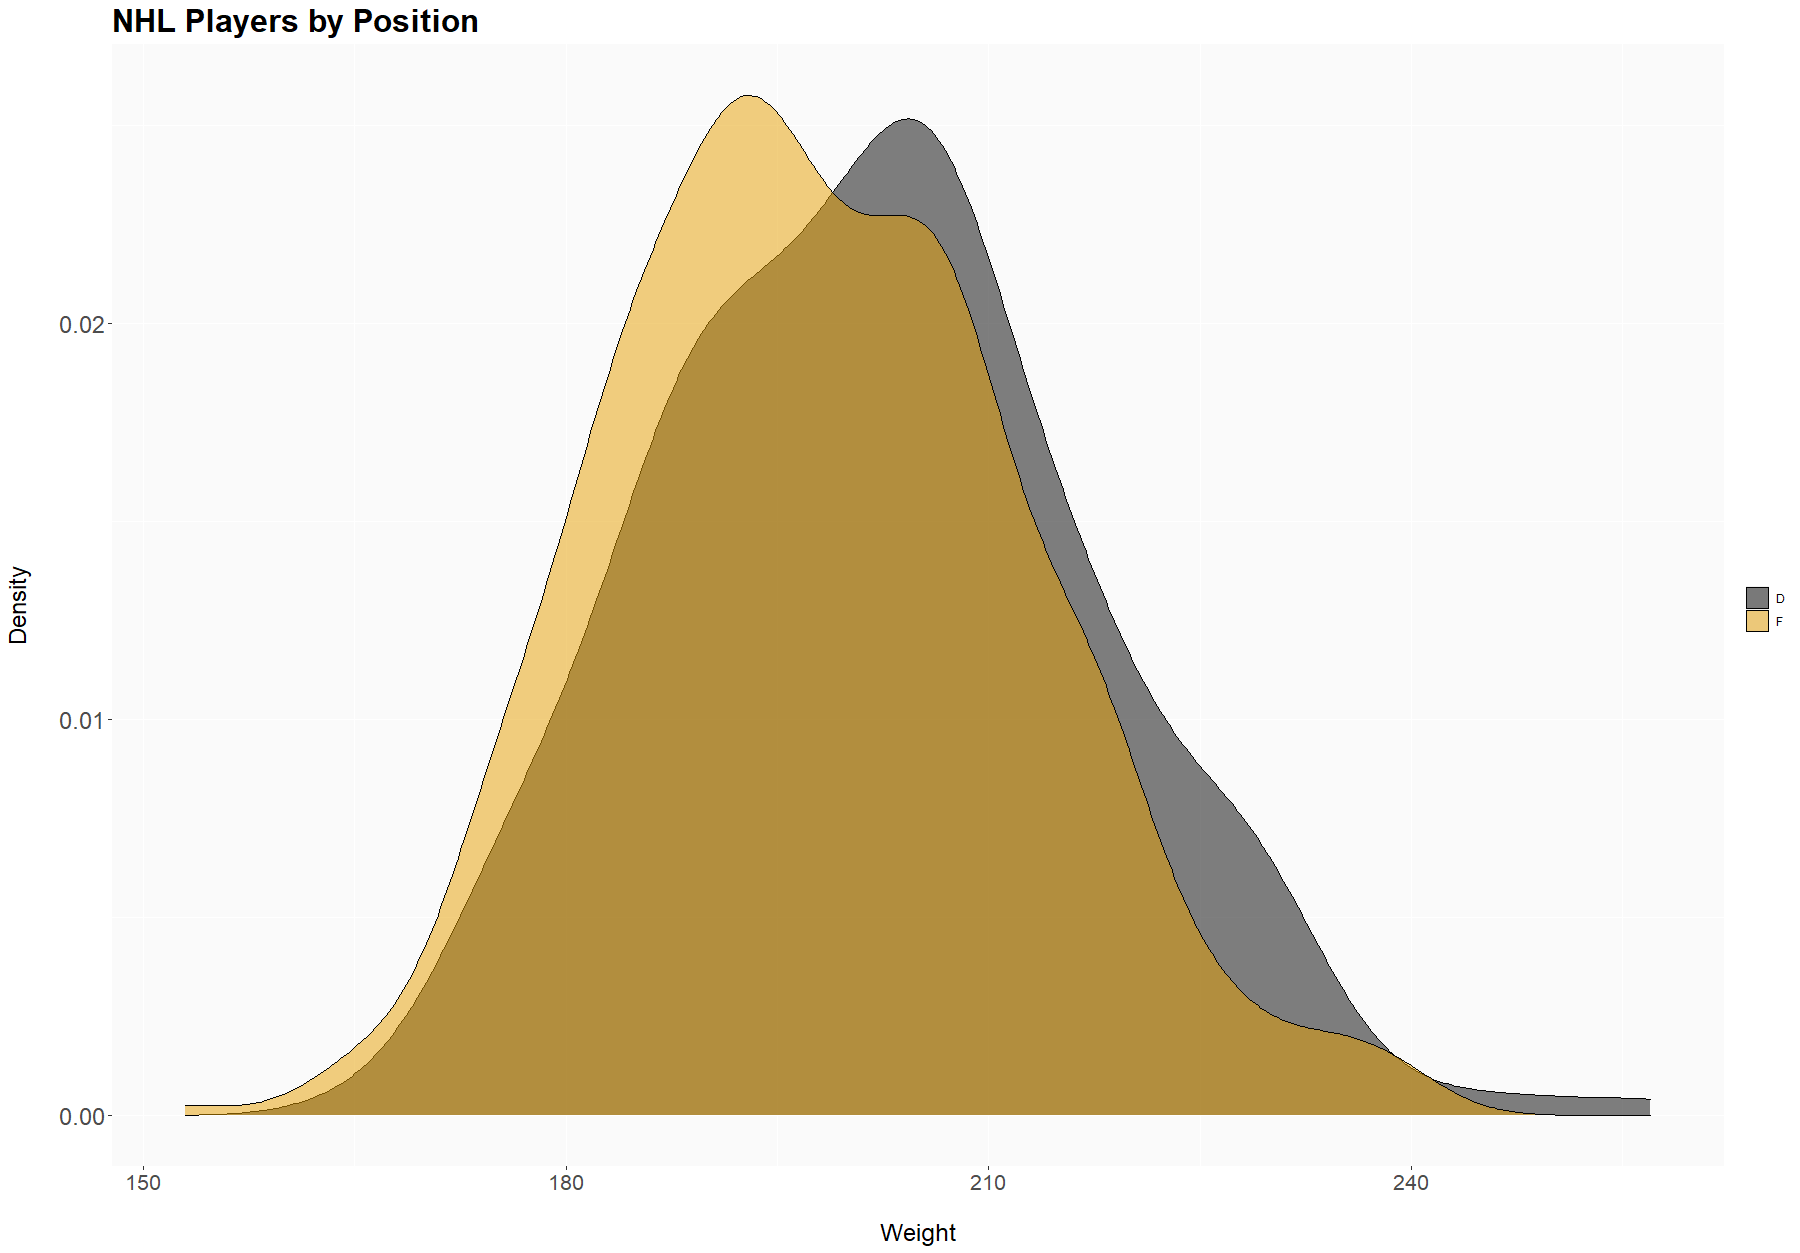
I found this the most interesting and surprising discovery in this exercise. Weights are barely different between defenders and forwards, while we casually think of the defence corps as much bigger on most teams. The means are 202 lbs and 197.8 lbs respectively, a difference of just over four pounds. The variation in measurements between defenders and forwards is much greater for height than for weight.
In the human population, weight varies with height in a relationship that should be easy to intuit.
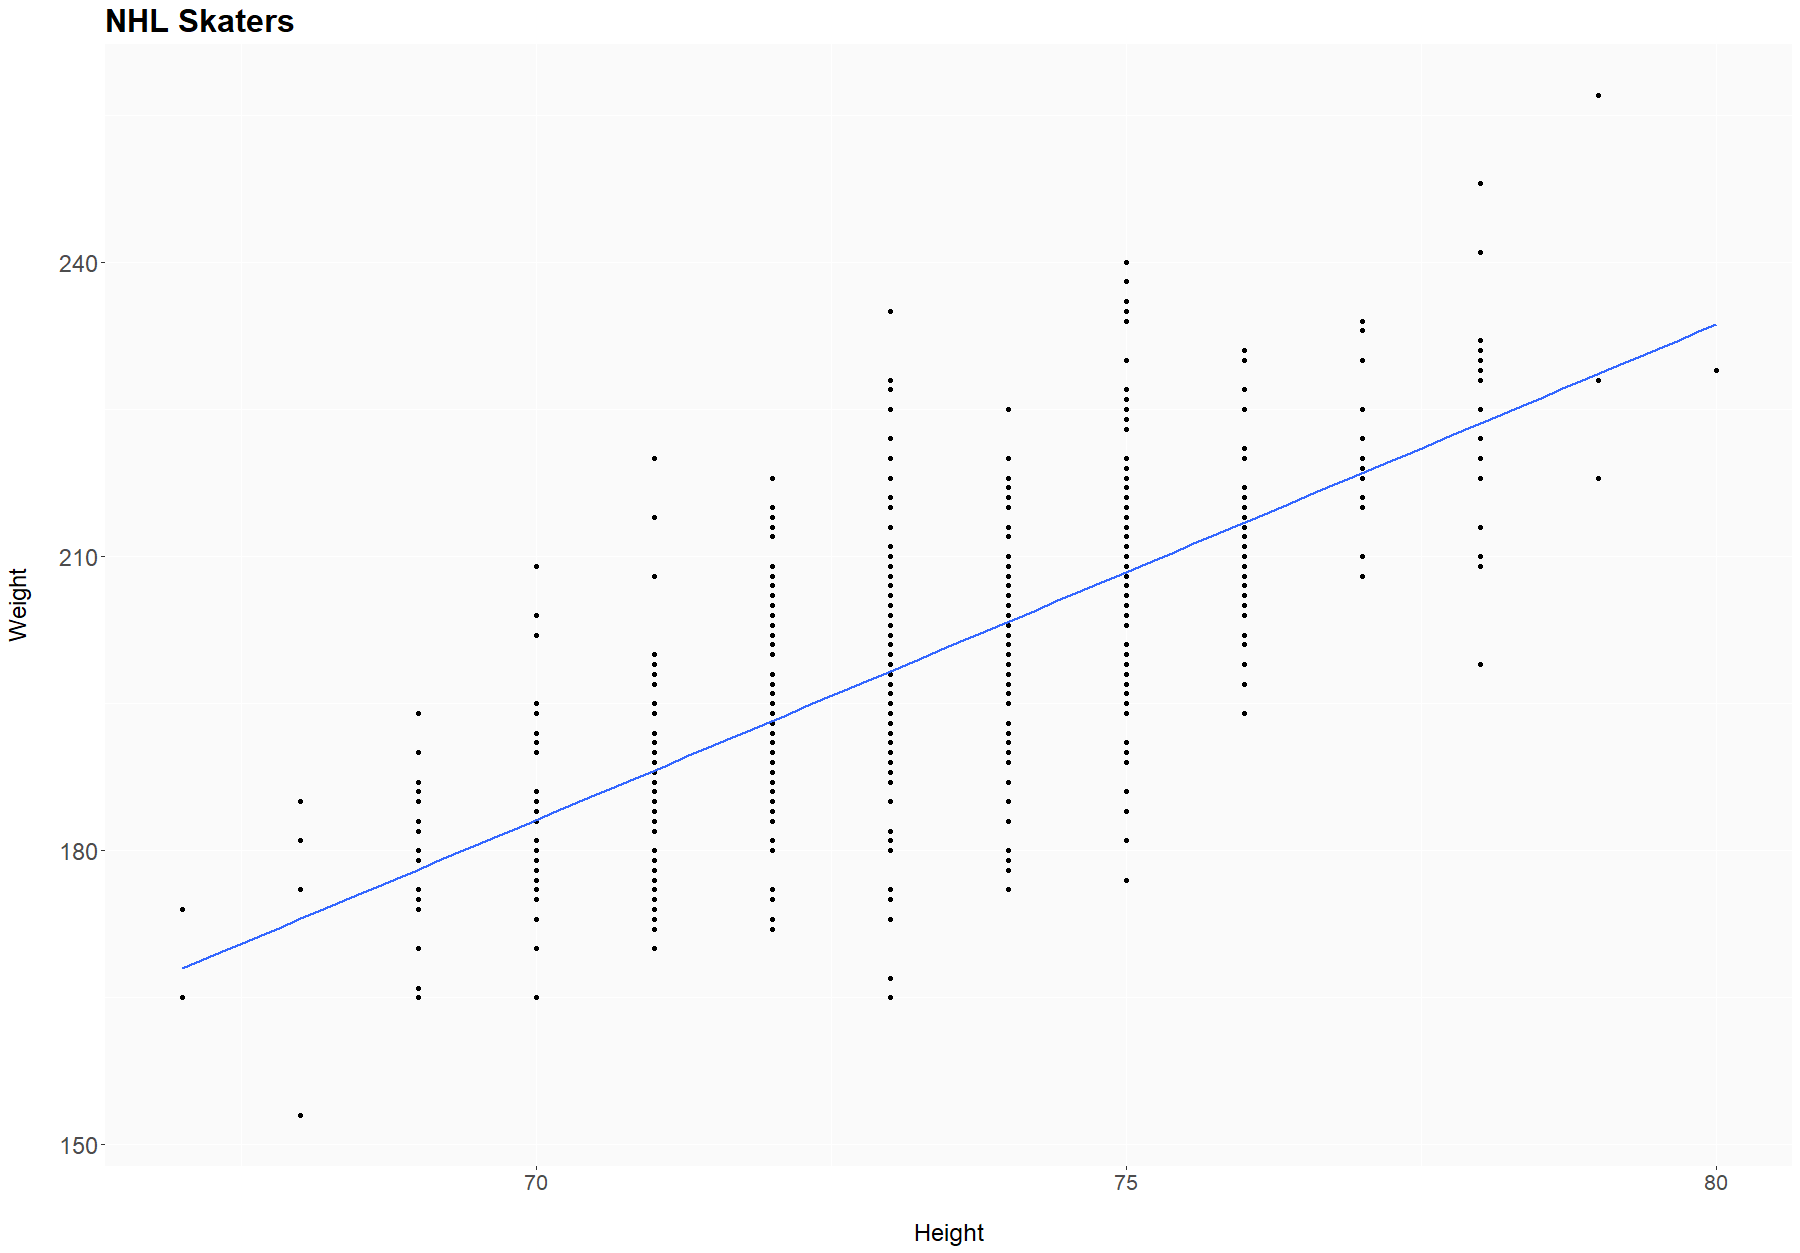
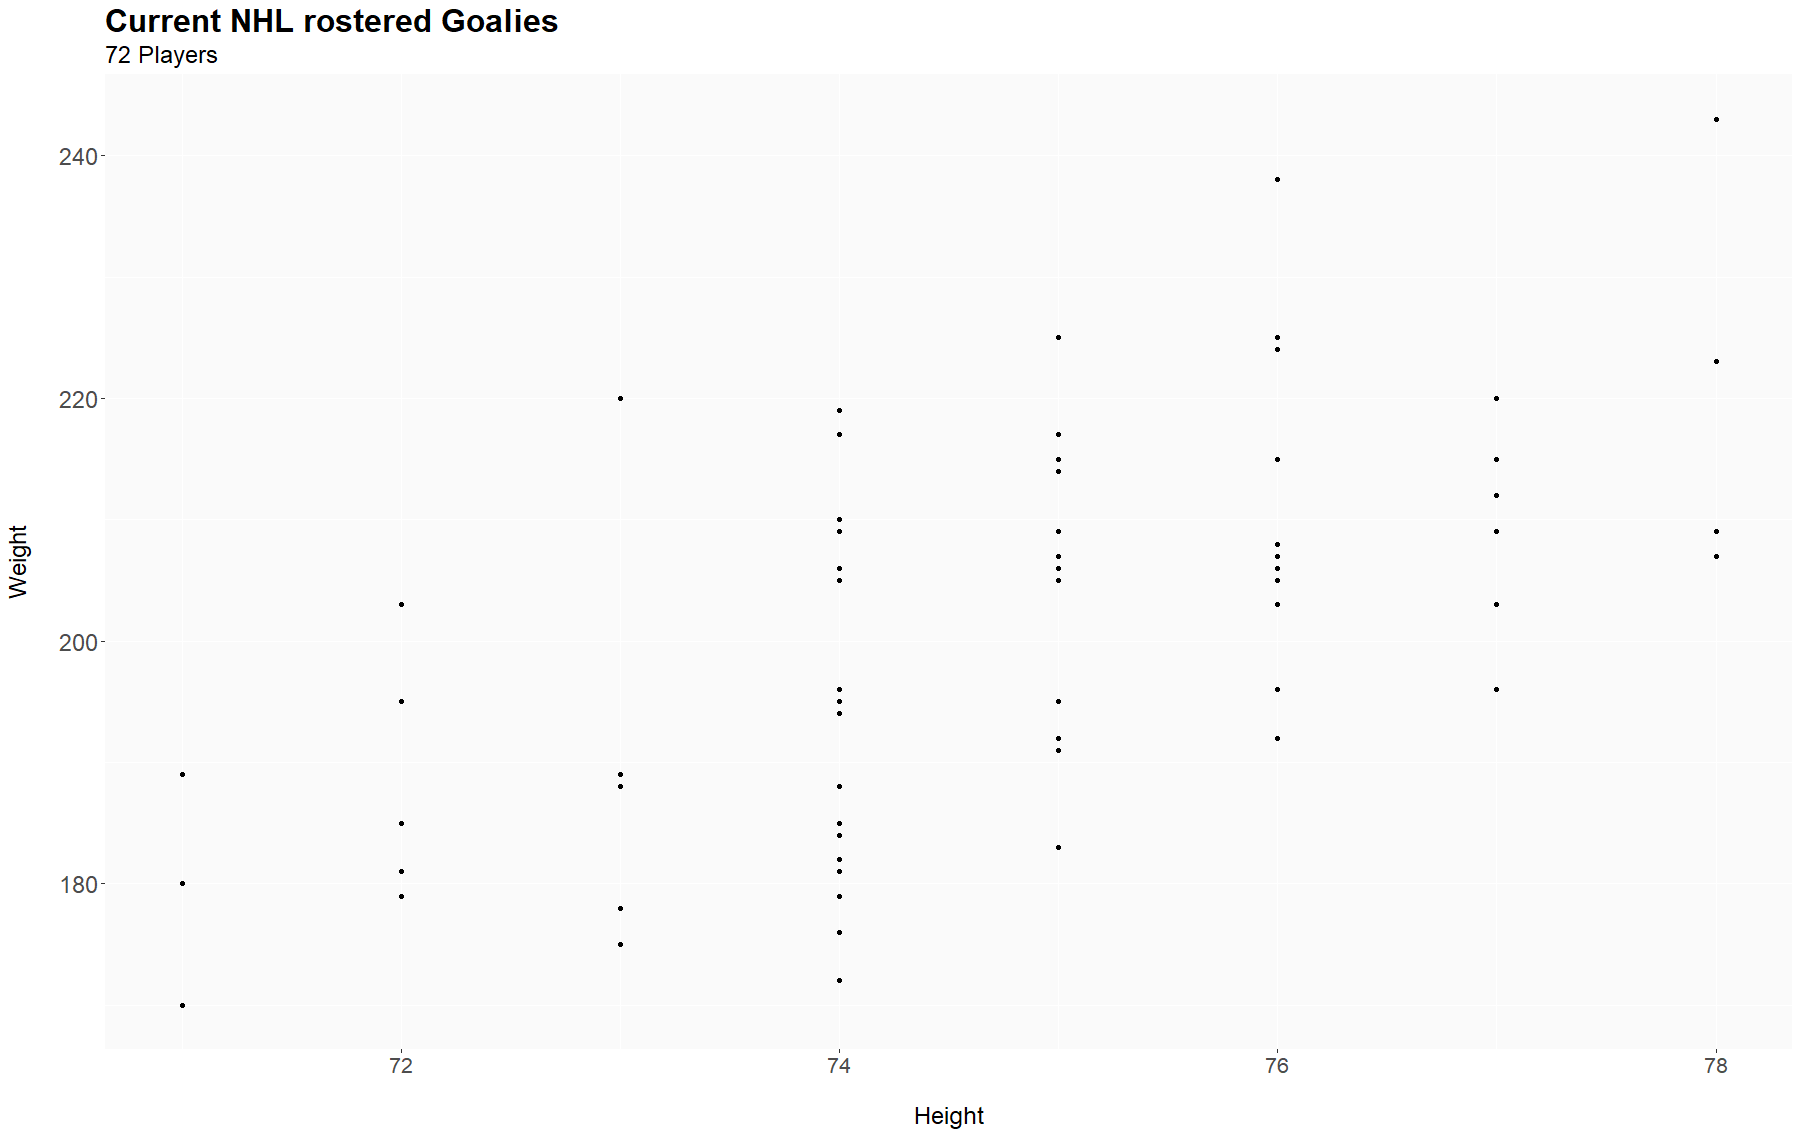
It very obviously does in the NHL skater population, too, but it pays to remember that the differences are small in both directions. For both defenders and forwards, half the NHLers are between 190 and 210 lbs. The quartiles are three to four pounds higher for defenders, just like the mean is. Goalies are in their own smaller range, and represent a body type distinct from skaters:
And now for the numbers you came here for:
Height, Weight and Age by Team
Mean Heights, Weights, Ages
| Team | Height (F) | Weight (F) | Height (D) | Weight (D) | Age |
|---|---|---|---|---|---|
| Anaheim Ducks | 73.38 | 202.46 | 73.44 | 199 | 27.22 |
| Arizona Coyotes | 74 | 204.83 | 73.36 | 198 | 25.45 |
| Boston Bruins | 73.67 | 202.5 | 73.86 | 202.43 | 26.71 |
| Buffalo Sabres | 72.87 | 198 | 73.57 | 202.57 | 23.29 |
| Calgary Flames | 72.92 | 201.92 | 74.43 | 208 | 26.86 |
| Carolina Hurricanes | 72.67 | 191.25 | 74.12 | 205.12 | 28.25 |
| Chicago Blackhawks | 72.93 | 196.21 | 75.71 | 211.71 | 27.14 |
| Colorado Avalanche | 72.25 | 193 | 73.57 | 202 | 27 |
| Columbus Blue Jackets | 73.07 | 193.29 | 73.38 | 196.25 | 24.75 |
| Dallas Stars | 73.46 | 200 | 73.43 | 203.57 | 28.57 |
| Detroit Red Wings | 73.36 | 197.36 | 73.86 | 201 | 26.29 |
| Edmonton Oilers | 72.92 | 198.15 | 73.86 | 203.43 | 26.57 |
| Florida Panthers | 72.77 | 191.85 | 73 | 200.22 | 28.89 |
| Los Angeles Kings | 72.5 | 202.43 | 73 | 199.29 | 26.71 |
| Minnesota Wild | 72.23 | 197.31 | 72.43 | 187.43 | 29.14 |
| Montréal Canadiens | 72.33 | 200 | 73 | 201.83 | 26.33 |
| Nashville Predators | 73.57 | 203.86 | 73.14 | 200.29 | 29.29 |
| New Jersey Devils | 72.19 | 188.38 | 74.71 | 206.29 | 26.43 |
| New York Islanders | 72.93 | 202.27 | 74.14 | 204.43 | 25.43 |
| New York Rangers | 73.46 | 200.15 | 73.43 | 197.86 | 23.43 |
| Ottawa Senators | 72.58 | 192.08 | 73.71 | 197.43 | 27.43 |
| Philadelphia Flyers | 72.83 | 194.08 | 73.5 | 197.12 | 27.75 |
| Pittsburgh Penguins | 72.38 | 192.23 | 73.62 | 194.88 | 29.88 |
| San Jose Sharks | 73.07 | 200.93 | 73.38 | 202.75 | 29.38 |
| Seattle Kraken | 72.2 | 188.93 | 75 | 210.29 | 27.29 |
| St. Louis Blues | 73.17 | 207.5 | 73.44 | 204.56 | 29.33 |
| Tampa Bay Lightning | 72.42 | 195.17 | 75.33 | 224.5 | 27 |
| Toronto Maple Leafs | 72.67 | 199.08 | 73.67 | 204.89 | 29.89 |
| Vancouver Canucks | 72.47 | 194.27 | 73.22 | 200.11 | 27.22 |
| Vegas Golden Knights | 73.07 | 203.4 | 74.5 | 207.5 | 29.83 |
| Washington Capitals | 73.47 | 201.24 | 73.43 | 203 | 30.43 |
| Winnipeg Jets | 73.93 | 196.27 | 73.56 | 197.89 | 26.44 |
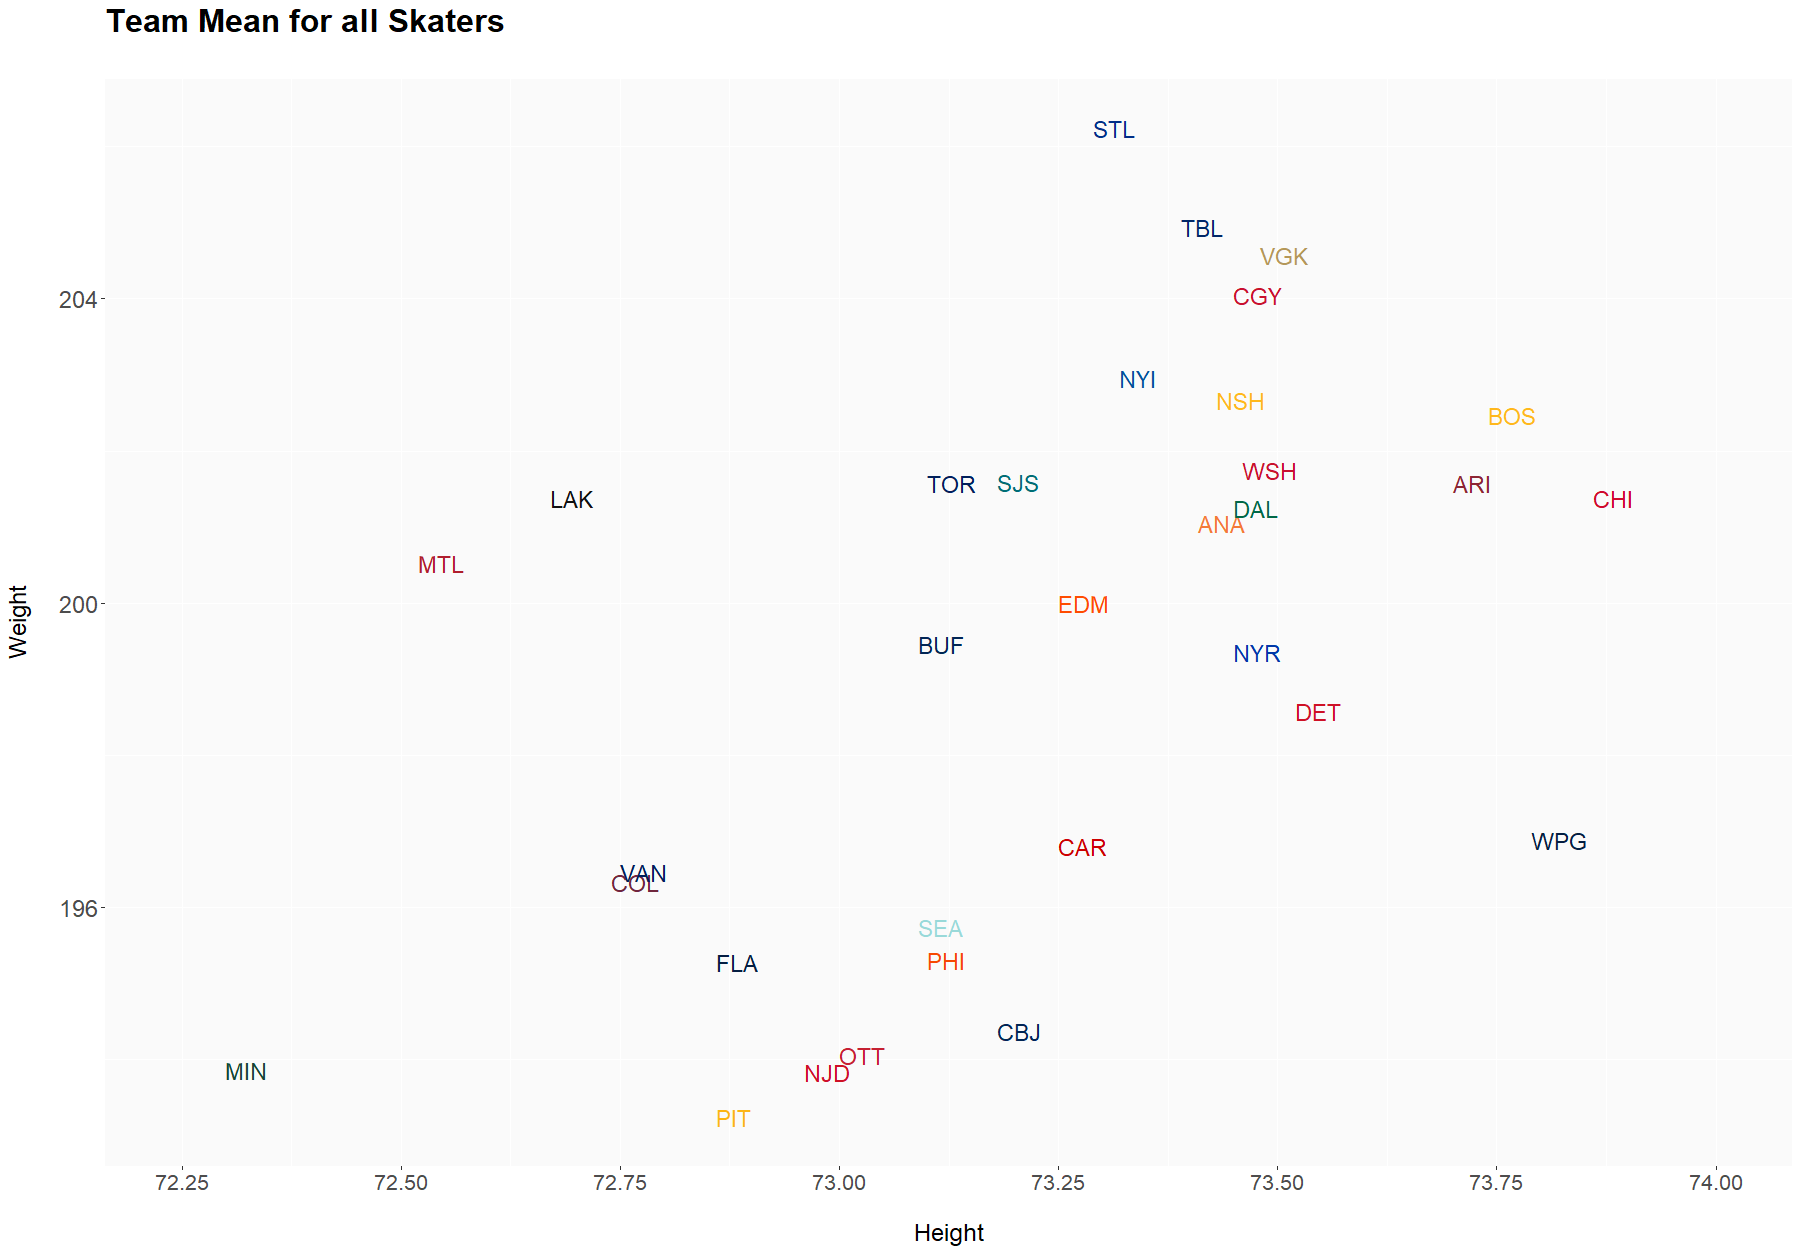
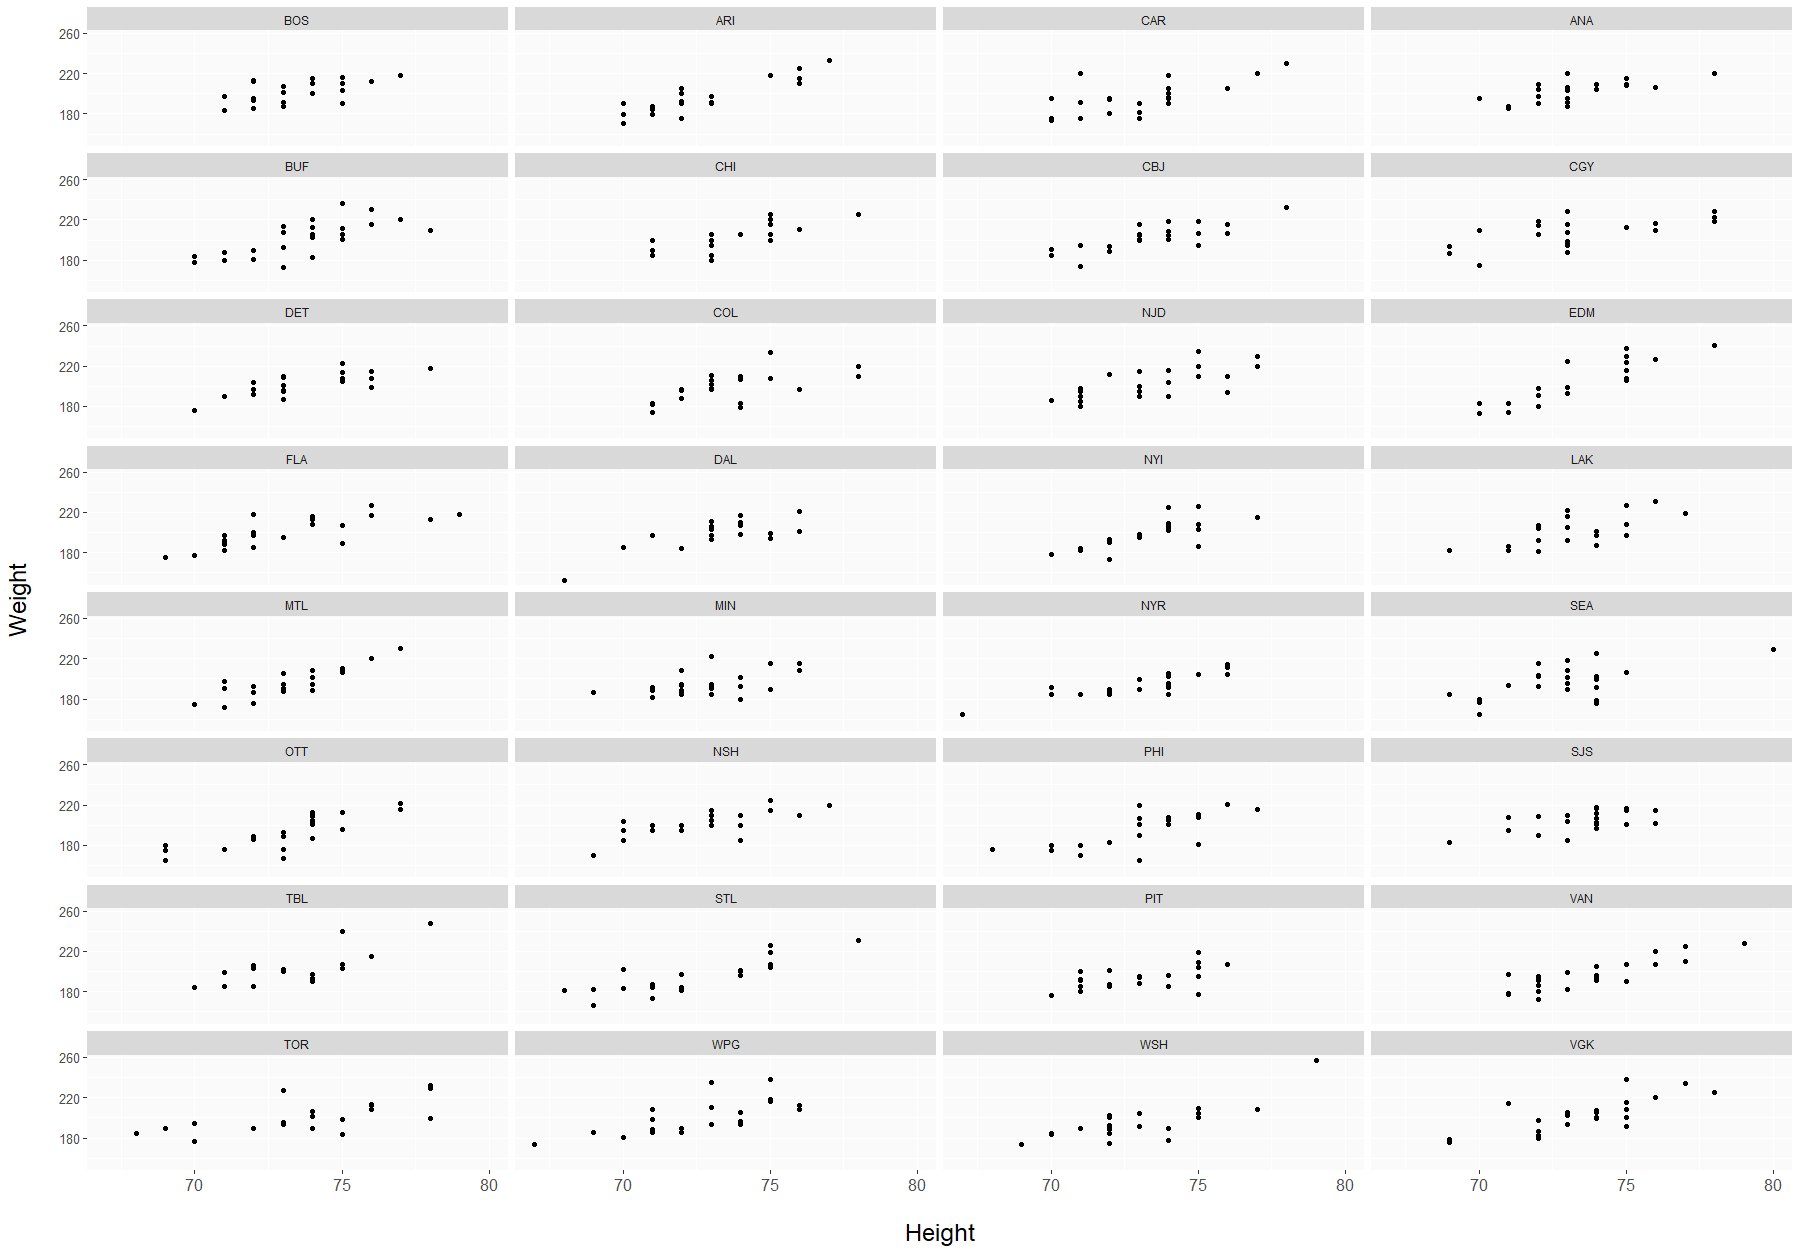
That’s just the means, with age as a bonus extra, but if you want to compare teams: first, the means listed above graphically displayed, and then a set of plots of everyone in the NHL in their team.
What Does All This Mean?
Despite the narratives that will be made around which team is taller or older or bigger, we have zero evidence that team makeup as expressed in this sort of set of measurements means anything at all. Which means we also have zero evidence it doesn’t matter, as well.
Hockey players are not a random sampling of humans. They are a group that goes through many layers of curation by many people. But in general, you don’t play hockey in the NHL unless NHL Central Scouting puts you on a list when you’re 18. And they make lists of younger teenagers before those draft-eligible lists are made. GMs, coaches and scouts select from those lists.
However, it’s hard to look at those charts of height distribution and not see the magic number of six. We’ve all seen people call a player who is 5’11” short, when the player who is 6’1” is considered a big man. If six feet tall is a conscious or subconscious benchmark for scouts, then the players who aren’t ever getting there are weeding themselves out of hockey as children by moving to some other sport, helped along by the junior systems that are ready to show the smaller kids the door. The best we can say is that shorter players tend to be drafted too low — but like all draft analysis this is a lagging indicator that tells us what was happening 10 years ago, and we can only guess if that’s still true today.
Are the scouts and GMs doing a good job of finding the best hockey players? Or are they biased by their emotional reactions to height — the same kind of bias that can be found in many areas of life, and notably hockey fandom. How efficient or inefficient is their choosing? That’s what we don’t know.
Given this unrepresentative sample of humans, it’s not very revealing to take something like height in the NHL and ask if it correlates with success as a way to judge the choosers. We’d only know how that correlation looks within the group of players we have. It’s more useful to ask if shot rate means anything — that’s behavioural and can be changed or coached — height isn’t. Might we discover that poorer quality players skew taller (grading on the NHL scale)? We might, and it doesn’t escape my notice that the two very shortest players in the NHL are very talented players. I believe that if Victor Mete, one of the shortest defenders in the game, was four inches taller, he’d have a guaranteed job. But anecdotes aren’t the answer to: Does size matter? More complex research might provide some clues, though.
Which size, though? I was already leaning towards a belief that weight mattered more for how a player might play (not how well). Weight is a proxy measurement of strength, speed, acceleration, power, force, etc. It seems to me that the NHL players agree with me. It’s impossible to overstate how outside the norm NHLers are by weight. If you plot their BMI — which is about the only way to compare them to ordinary people — you get an astonishing distribution with an incredibly high density peak and a grouping around the mean so tight, you might as well call them all the same. The NHL has a standard size, and the variation in it, caused to some degree by variation in height, is minimal.
Is there a legitimate lower limit on height in the NHL? Maybe it’s imaginary. Maybe it’s a real factor of the weight that can be achieved at shorter heights, but my biggest takeaway from this is that the difference between a guy who is 5’10 and one who is 6’2” is in our heads, and the smartest thing is to ignore height entirely because even if it matters, it doesn’t matter more than skill, work ethic and luck. If you deeply and utterly believe that size is always important, then I invite you to do a little project of your own. Write down everything you know about Cale Makar and Victor Hedman and then see if they aren’t more alike than they are different.

Comment Markdown
Inline Styles
Bold: **Text**
Italics: *Text*
Both: ***Text***
Strikethrough: ~~Text~~
Code: `Text` used as sarcasm font at PPP
Spoiler: !!Text!!